Performance · LCP · Chrome
Why LCP varies: repeated measurements and Chrome tracing
Author: Grundy · Checked: October 23, 2026
Individual checks after the CSS optimization looked promising, but insertion-sort LCP still varied from roughly 1.4 to 4.9 seconds. We repeated the measurements, separated frame preparation from presentation and built a reproducer without the application. This article collects the graph, medians, traces and limits of the evidence: we localized a wait in the local reproducer, but the exact cause of slow Google PageSpeed runs remains unconfirmed.
1. Measure variability instead of keeping the best run
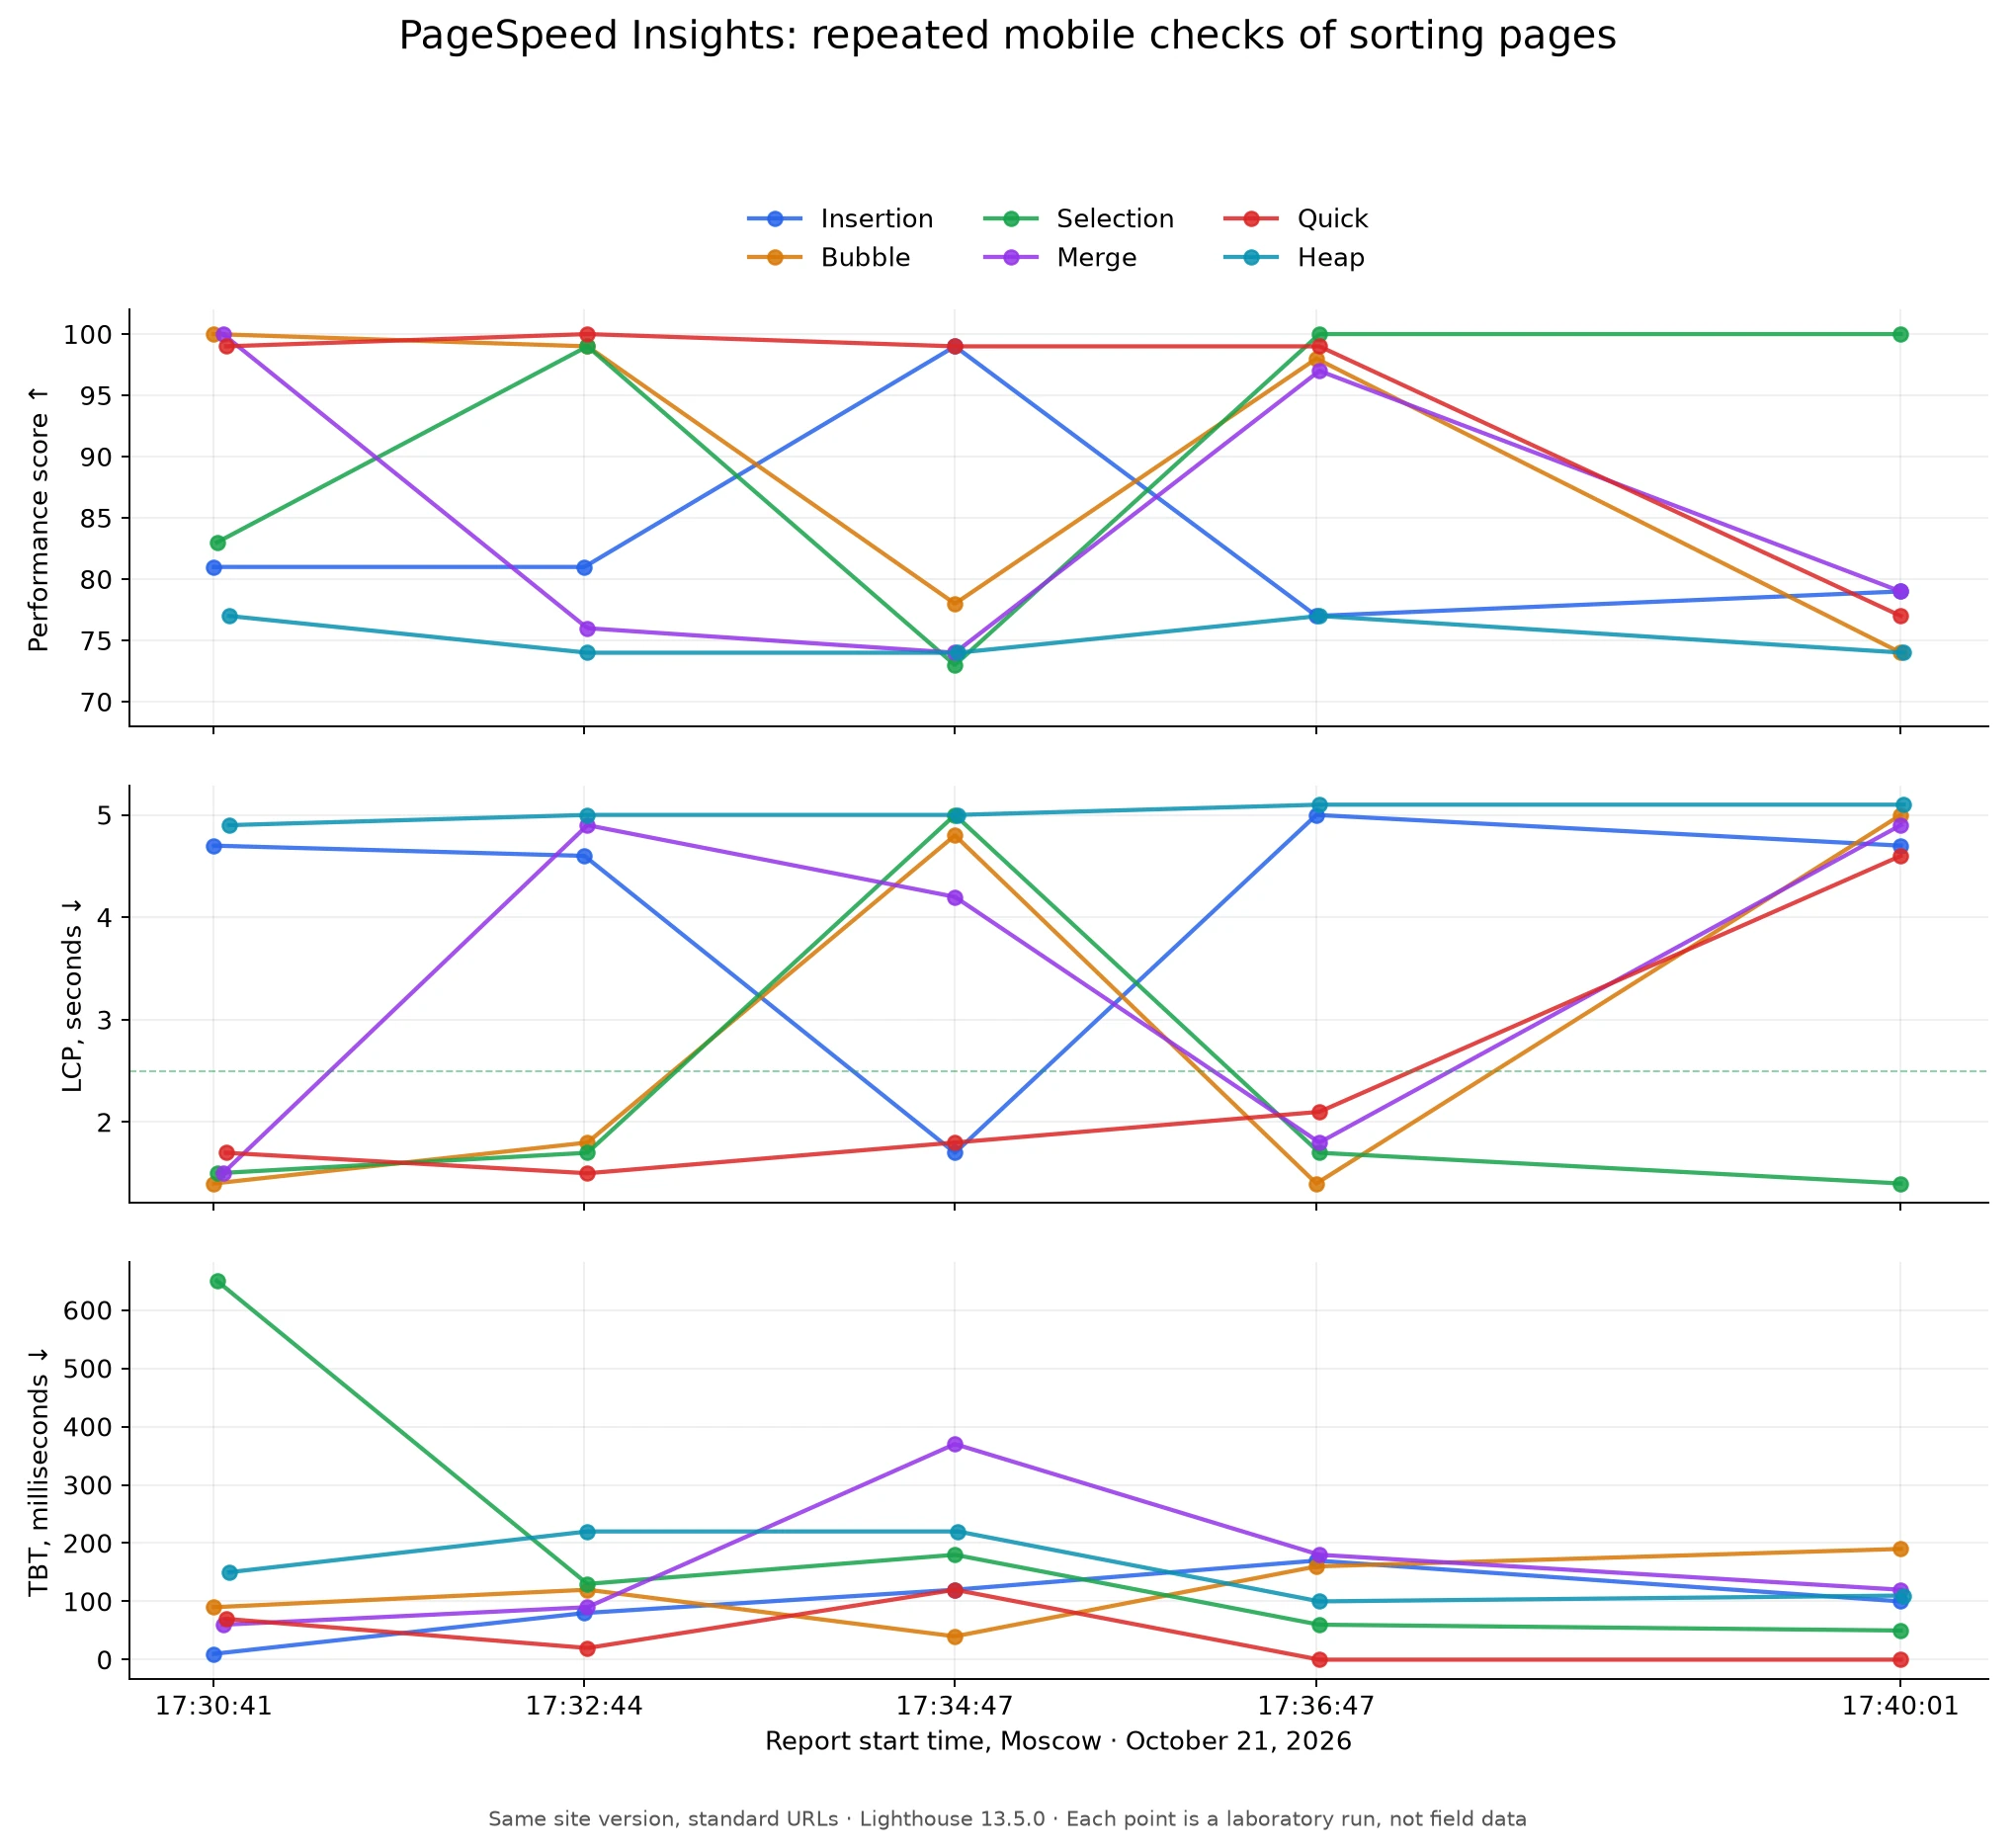
A later check returned 81 for insertion sort, so the earlier 100 was not reproducible on every run. We then ran five mobile checks of each of the six sorting pages over roughly ten minutes, from 17:30 to 17:40 Moscow time on October 21. All 30 reports used Lighthouse 13.5.0, the same published site version and standard URLs without diagnostic parameters. Six checks were launched in each batch; the plotted times are the report start times. The graph shows performance score, LCP and TBT, while the table gives the median and full range of the five runs per page. These are separate runs, not a continuous monitor.
| Page | Median score | Score range | Median LCP, s | LCP range, s | Median TBT, ms |
|---|---|---|---|---|---|
| Insertion sort | 81 | 77–99 | 4.7 | 1.7–5 | 100 |
| Bubble sort | 98 | 74–100 | 1.8 | 1.4–5 | 120 |
| Selection sort | 99 | 73–100 | 1.7 | 1.4–5 | 130 |
| Merge sort | 79 | 74–100 | 4.2 | 1.5–4.9 | 120 |
| Quick sort | 99 | 77–100 | 1.8 | 1.5–4.6 | 20 |
| Heap sort | 74 | 74–77 | 5 | 4.9–5.1 | 150 |
No page achieved 99–100 in all five runs. Insertion sort, merge sort and heap sort had median LCP above four seconds. These observations do not establish the cause of the variability or prove a regression: there was no simultaneous control version, and the reports contain no field data. Five runs describe this short window, not long-term reliability. CLS was zero in all 30 runs.
All 30 reports, grouped by page
- Insertion sort: Run 1 (81)Run 2 (81)Run 3 (99)Run 4 (77)Run 5 (79)
- Bubble sort: Run 1 (100)Run 2 (99)Run 3 (78)Run 4 (98)Run 5 (74)
- Selection sort: Run 1 (83)Run 2 (99)Run 3 (73)Run 4 (100)Run 5 (100)
- Merge sort: Run 1 (100)Run 2 (76)Run 3 (74)Run 4 (97)Run 5 (79)
- Quick sort: Run 1 (99)Run 2 (100)Run 3 (99)Run 4 (99)Run 5 (77)
- Heap sort: Run 1 (77)Run 2 (74)Run 3 (74)Run 4 (77)Run 5 (74)
2. Recheck insertion sort after deferring the palette controls and footer
We then changed the shared site shell: the closed color ribbon renders gradients, creates its range inputs only when opened and removes them when closed. The footer uses content-visibility: auto with an estimated height. After publishing, we checked the standard insertion-sort URL again on October 22, from 05:53 to 05:56 Moscow time. The three independent mobile PageSpeed results were 100, 81 and 79, with LCP at 1.368, 4.500 and 4.853 seconds. The introductory paragraph remained the LCP element. The slow reports attributed 1.40–1.51 seconds to element render delay in their LCP breakdown; these breakdown values are not the full modeled LCP. The new median LCP was 4.50 seconds versus 4.70 in the earlier five-run series, while the median score remained 81. Median TBT fell from 100 to 0 ms and CLS remained zero. This follow-up did not establish a stable LCP improvement: fast and slow runs still occurred, the samples are small and the two versions were not tested simultaneously. Lower TBT alone does not establish that the frame-presentation delay has been resolved.
| Run · Moscow time | Score | FCP, s | LCP, s | TBT, ms | CLS | PageSpeed |
|---|---|---|---|---|---|---|
| 1 · 05:53 | 100 | 0.91 | 1.37 | 0 | 0 | Report 1 |
| 2 · 05:54 | 81 | 2.08 | 4.50 | 0 | 0 | Report 2 |
| 3 · 05:56 | 79 | 2.08 | 4.85 | 31 | 0 | Report 3 |
Lighthouse 13.5.0, emulated Moto G Power and slow 4G, HeadlessChromium 153.0.8010.36. All three reports scored 100 for accessibility, best practices and SEO, and contained no field data. An additional report repeated the preceding capture time and exact metrics; we excluded it as a possible duplicate. The table rounds FCP and LCP to two decimal places.
| Metric | October 21 · 5 runs | October 22 · 3 runs |
|---|---|---|
| Median score | 81 | 81 |
| Median LCP, s | 4.70 | 4.50 |
| LCP range, s | 1.70–5.00 | 1.37–4.85 |
| Median TBT, ms | 100 | 0 |
| Median CLS | 0 | 0 |
3. Reproduce the delay outside the application and Lighthouse
We built a standalone fixture: 109,220 bytes of static HTML and a 555-byte stylesheet, with no framework, application scripts, canvas, images, web fonts or animation. The runner injects passive timing observers through CDP and deliberately delays the stylesheet response by 200 ms. On Windows x64, Chrome 155.0.8059.80 and chrome-launcher 1.2.2, we compared direct navigation, navigation through about:blank in a retained tab, and a fresh tab. Both arms retain all launcher defaults; the comparison arm removes only RenderDocument from the disabled-feature list and explicitly enables it. The 48 untraced loads used two isolated Chrome processes per arm, with four loads per navigation scenario in each process. Repeated loads within a process are not independent samples. These are native paint-to-presentation timings, not PageSpeed scores or simulated LCP.
| Condition | Gap > 500 ms / loads | Full gap range, ms |
|---|---|---|
| Default flags · Direct repeat navigation | 0/8 | 17.4–41.7 |
| Default flags · Retained tab via about:blank | 7/8 | 54.5–1,024.2 |
| Default flags · Fresh tab | 0/8 | 25.0–40.4 |
| RenderDocument enabled · Direct repeat navigation | 0/8 | 28.6–67.1 |
| RenderDocument enabled · Retained tab via about:blank | 0/8 | 24.3–54.2 |
| RenderDocument enabled · Fresh tab | 0/8 | 30.9–42.6 |
4. Locate the wait between activation and frame submission
A separate raw-stream trace series correlates the presented target frame with the renderer, its layer tree and the Viz frame sink. In one slow load, the new tree was activated at 1172.167 ms, but its compositor frame was not submitted until 2137.322 ms. The traced activation-to-submission stage lasted 965.154 ms; submission to presentation took just 15.093 ms. A second slow load spent 972.751 ms in the same stage, while the RenderDocument controls took about 0.5–1.4 ms. Another capture with explicit task scopes repeated waits of 971.0 and 968.1 ms. The target received BeginFrames at 135.855, 1135.854 and 2135.918 ms. Meanwhile, the browser requested surface 5 while the renderer continued submitting surface 3; surface 5 was aggregated shortly after arriving. This localizes the measured wait before submission, rather than to the final swap or presentation after submission.
| Event | Time, ms |
|---|---|
| Stylesheet response complete | 224.1 |
| Paint Timing: paintTime | 1,149.1 |
| New layer tree activated | 1,172.167 |
| Target compositor frame submitted | 2,137.322 |
| Viz receives that frame | 2,137.526 |
| Target frame aggregated | 2,137.724 |
| Buffer swap finished | 2,140.047 |
| PipelineReporter: presentation | 2,152.414 |
| Paint Timing: presentationTime | 2,156.0 |
The Paint Timing API and PipelineReporter presentation timestamps are distinct observations; the table keeps both. The trace series is separate from the 48-load comparison above. Open the published report and download the reproducer and traces in Lighthouse #17148.
5. Report the evidence without treating a hypothesis as a fix
Viz records ThrottleUndrawnFrames during the waits, consistent with the roughly one-second BeginFrame cadence. However, those refusal records omit the frame-sink identifier, so timestamp proximity cannot prove each refusal belongs to our target. During the first 965 ms interval, captured task scopes cover about 1.65 ms on renderer main and 0.75 ms on renderer compositor; these durations neither measure CPU usage nor prove every thread is idle. The historical trace-completion loss flag was not retained. Reusing a RenderFrameHost alone is also insufficient: direct repeat navigation can reuse it and stay fast. We published the standalone reproducer, three full sanitized traces, correlation scripts and checksums in Lighthouse #17148, asking maintainers to identify the surface/BeginFrame dependency and check RenderDocument disablement. We do not have a full trace of a slow Google PSI run, so its exact cause and internal flags remain unconfirmed. This is not a resolved Chromium bug, a production workaround or proof that all remaining LCP variation has one cause.